Defining Development
|
Economic Development - an increase in a country's level of wealth. This could be accompanied by a decrease in the numbers employed in agriculture and an increase in manufacturing and services.
-This usually lead to greater access to and use of natural resources, resulting in more energy being used per head of the population Demographic Development - an increase in life expectancy and an overall fall in the death rate (including the infant mortality rate) combined with falling birth rates.
Social Development - a range of changes affecting the quality of life of the population.
- Improvements in education, literacy, sanitation, infrastructure and increases in personal freedom. Political Development - freedom means that more people have a greater say in who forms the government which will influence their lives.
Cultural Development - greater equality for women and better race relations in multicultural societies.
|
Measuring Development
|
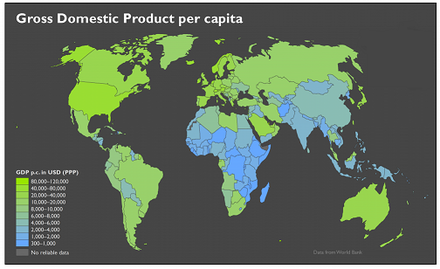
The most common measurements of the development of a country are the Gross Domestic Product (GDP) or the Gross National Product (GNP).
- GDP is the total value of all finished goods and services produced by a country in a year. - GNP is the total value of all finished goods and services produces by a country in a year, plus all net income earned by that country and its population from overseas sources. Both values are expressed in amount per head of population (per capita) and are given in US dollars for comparison. The figure on the right shows GDP per capita across the globe. |
|
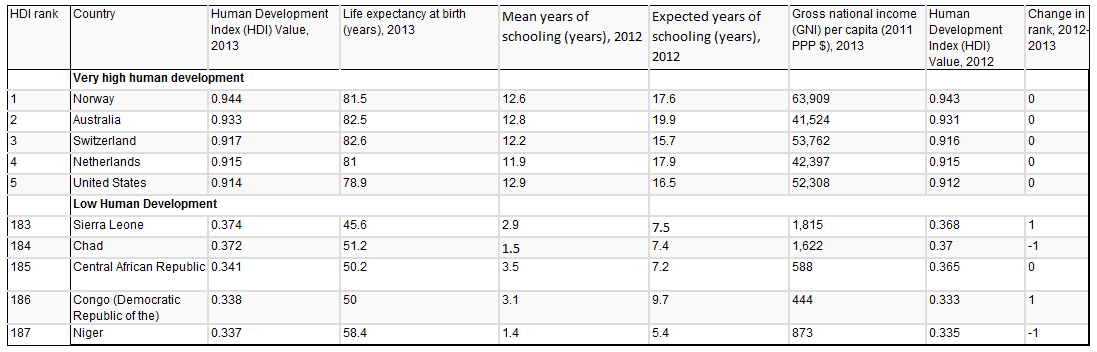
Alternatively the Human Development Index (HDI) can be used to measure a country's development. This is widely used and is a better way of measure compared to the GDP or GNP as it considers:
- Life expectancy at birth
- Education and adult literacy
- Real GDP per capita (based on purchasing power of people's income)
The highest figure a country can achieve is 1.0 and countries with figure below 0.5 are considered to represent low levels of development. The table below shows the top 5 and bottom 5 countries when ranked in HDI rank order (2014 Data from United Nations Development Programme UNDP).
Click Here to view the full HDI table and to access other data on developments by UNDP.
Using these measures countries can be divided by development classifications. Click next to see these classification and some of the countries within them.
